by Colin McCabe
A unique dynamic of the global oil industry supply-chain is the use of stored oil, called inventories, to buffer changes in supply and demand. Unlike many other commodities where production feeds directly into demand (e.g. production of oranges transported to the grocery store), oil producers have the ability to use inventories as well as new production to satisfy demand. Specifically, inventories allow producers to draw on reserve supply in response to unexpected shocks to supply and demand. Therefore, oil inventories – by being a component of supply – reflect market pressures on oil prices and provide a good barometer of oil price change.
There are a multitude of factors that can influence global oil inventories: from technological advances which increase production and storage capacity, to changes in taxation policies, to political unrest in the Middle East encouraging the increase of stockpiles. However, generally changes in inventory levels are the result of two main factors: (1) producers build or draw down discretionary inventories based on their price expectations and sale opportunities, and/or; (2) uncertainties or unexpected changes in supply and demand.
For example, decisions made by members of the Organization of Petroleum Exporting Countries [OPEC] to cut output in the fourth quarter of 2006 have reduced inventory levels and contributed to US prices remaining at about $60 per barrel on average in the fourth quarter (EIA, 2006). The US Energy Administration explains:
OPEC members’ crude oil production in the fourth quarter averaged 0.7 million barrels per day below third quarter levels, with Saudi Arabia accounting for half of this reduction. Preliminary data suggest commercial inventories in Organization for Economic Cooperation and Development [OECD] countries dropped by about 1 million barrels per day in the fourth quarter, about 0.45 million barrels greater than the normal seasonal decline, leaving inventories at near normal levels at year-end. On a days-of-supply basis, OECD inventories are projected to decline from close to the top of the normal range during the third quarter of 2006 to near the bottom of the normal range by the end of 2007 (EIA, 2006).
Regardless of the cause of their change, inventories provide an indication of whether the market is in a state of excess demand or over-production. For much of last year the oil market was in a state of over-production as producers operated at full-tilt trying to cash-in on record high oil prices. This excess, however, saturated the market and is now a key contributor to oil’s sharp decline in price (which bottomed out at a hair above $50 last week after a high of more than $77 last summer).
Changes in oil inventories have demonstrated a highly cyclical pattern. Typically, oil inventories increase in the summer months and decrease in the winter months. This is because cold temperatures in the winter increase the use of distillate heating oils and residual fuels pushing demand above supply and resulting in a need to tap inventories. Likewise, during warm summer months, supply generally exceeds demand and petroleum inventories build (despite the infamous summer ‘driving season’).
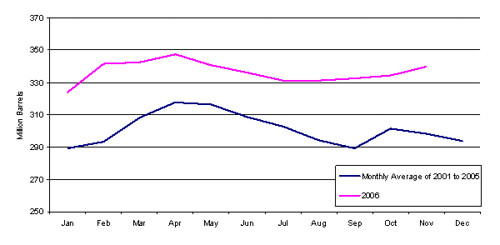
Figure 1 below provides a comparison of the average monthly oil inventories in the US from 2001 to 2005, with monthly oil inventories in 2006. As the figure shows, the market in 2006 maintained a higher oil inventory stock than the monthly averages of the previous five years. The figure also demonstrates the aforementioned cyclical and seasonal pattern in oil inventories; specifically, oil inventories are lower in fall and winter months (i.e. September to January), and higher in spring and summer months (i.e. April to July).
Looking at the average monthly oil inventories from 2001 to 2005, the lowest point was approximately 289 million barrels occurring in September. Conversely, inventories peaked in April at nearly 318 million barrels.
To compare, 2006 inventories hit a low of 324 million barrels in January (12.1% higher than the 2001-2005 average) and peaked in April at 347 million barrels (9.1% higher than the 2001-2005 average). In fact, the year 2006 had an average inventory level of 335 million barrels - the highest since 1994.
A unique dynamic of the global oil industry supply-chain is the use of stored oil, called inventories, to buffer changes in supply and demand. Unlike many other commodities where production feeds directly into demand (e.g. production of oranges transported to the grocery store), oil producers have the ability to use inventories as well as new production to satisfy demand. Specifically, inventories allow producers to draw on reserve supply in response to unexpected shocks to supply and demand. Therefore, oil inventories – by being a component of supply – reflect market pressures on oil prices and provide a good barometer of oil price change.
There are a multitude of factors that can influence global oil inventories: from technological advances which increase production and storage capacity, to changes in taxation policies, to political unrest in the Middle East encouraging the increase of stockpiles. However, generally changes in inventory levels are the result of two main factors: (1) producers build or draw down discretionary inventories based on their price expectations and sale opportunities, and/or; (2) uncertainties or unexpected changes in supply and demand.
For example, decisions made by members of the Organization of Petroleum Exporting Countries [OPEC] to cut output in the fourth quarter of 2006 have reduced inventory levels and contributed to US prices remaining at about $60 per barrel on average in the fourth quarter (EIA, 2006). The US Energy Administration explains:
OPEC members’ crude oil production in the fourth quarter averaged 0.7 million barrels per day below third quarter levels, with Saudi Arabia accounting for half of this reduction. Preliminary data suggest commercial inventories in Organization for Economic Cooperation and Development [OECD] countries dropped by about 1 million barrels per day in the fourth quarter, about 0.45 million barrels greater than the normal seasonal decline, leaving inventories at near normal levels at year-end. On a days-of-supply basis, OECD inventories are projected to decline from close to the top of the normal range during the third quarter of 2006 to near the bottom of the normal range by the end of 2007 (EIA, 2006).
Regardless of the cause of their change, inventories provide an indication of whether the market is in a state of excess demand or over-production. For much of last year the oil market was in a state of over-production as producers operated at full-tilt trying to cash-in on record high oil prices. This excess, however, saturated the market and is now a key contributor to oil’s sharp decline in price (which bottomed out at a hair above $50 last week after a high of more than $77 last summer).
Changes in oil inventories have demonstrated a highly cyclical pattern. Typically, oil inventories increase in the summer months and decrease in the winter months. This is because cold temperatures in the winter increase the use of distillate heating oils and residual fuels pushing demand above supply and resulting in a need to tap inventories. Likewise, during warm summer months, supply generally exceeds demand and petroleum inventories build (despite the infamous summer ‘driving season’).
Figure 1 below provides a comparison of the average monthly oil inventories in the US from 2001 to 2005, with monthly oil inventories in 2006. As the figure shows, the market in 2006 maintained a higher oil inventory stock than the monthly averages of the previous five years. The figure also demonstrates the aforementioned cyclical and seasonal pattern in oil inventories; specifically, oil inventories are lower in fall and winter months (i.e. September to January), and higher in spring and summer months (i.e. April to July).
Looking at the average monthly oil inventories from 2001 to 2005, the lowest point was approximately 289 million barrels occurring in September. Conversely, inventories peaked in April at nearly 318 million barrels.
To compare, 2006 inventories hit a low of 324 million barrels in January (12.1% higher than the 2001-2005 average) and peaked in April at 347 million barrels (9.1% higher than the 2001-2005 average). In fact, the year 2006 had an average inventory level of 335 million barrels - the highest since 1994.
Further to the discussion of variation in oil inventory and prices, Figure 2 below provides a comparison of the average oil inventory levels and the average price per barrel of oil in the US from 2001 through 2006. As Figure 2 demonstrates, there tends to be an inverse relationship between inventory levels and price: as inventories increase, prices tend to decrease.
Further to the discussion of variation in oil inventory and prices, below provides a comparison of the average oil inventory levels and the average price per barrel of oil in the US from 2001 through 2006. There tends to be an inverse relationship between inventory levels and price: as inventories increase, prices tend to decrease.
Historically speaking, crude oil prices are much more variable than inventories. Except for a spike in 1990 (attributable to a US recession and the invasion of Iraq) prices remained close to the $20 per barrel mark, until early 1998 when prices began to decline. Oil prices recovered strongly in early 1999 and have experienced a substantial increase since, to reach over $77 per barrel in the summer of 2006.
Cushing OK WTI Spot Price ($USD per Barrel), 1990 to 2006
A long-term non-SPR crude oil inventories and long-term oil consumption. As you can see, non-SPR inventories are starting to recover from a 20-year declining trend. In 1986, inventories were 331 million barrels on average, whereas in 2003 the average fell to a low 282 million barrels. Inventory levels have since picked up averaging 324 million barrels in 2005 and 335 million barrels in 2006 for a 4% year-over-year
increase.
You can also see that the US consumption of petroleum has shown a relatively stable increase over time, from 16,280 thousand barrels per day on average in 1986, to 20,802 thousand barrels per day on average in 2005.
A comparison of consumption and inventory patterns reveals a real decrease in the ability of inventory levels to sustain consumption at any given time. For example, in 1990 the average inventory level was 323 million barrels while the average consumption level was 16,988 thousand barrels per day – meaning inventories would have lasted approximately 19 days. In 2006, the average inventory level was 338 million barrels while the consumption averaged 20,561 barrels per day, meaning inventories would have lasted 16 days.
Also the cyclical nature of oil inventories. That is, the consistent ramp up in inventories during the summer months to satisfy higher winter demand and the subsequent draw down of those inventories in the winter months.
Looking Ahead: Short-term Outlook
Relatively high inventory levels suggest near-term oil price stagnation. However, colder weather forecasted for much of the lower 48 states and OPEC production cuts coming into effect soon should hasten inventory draw downs. As well, historical month-over-month percentage changes in price point to higher prices. The average percentage change of price in the months of February, March, and April from 2001 to 2005 is 3.6, 4.5, and 2.1, respectively.
Furthermore, the EIA’s Short-Term Energy Outlook released on January 9, 2007 projects that energy demand will increase at annual rates of about 1.2 and 1.7 percent over the next couple years. During that time the expected price of West Texas Intermediate [WTI] crude oil is $64.42 per barrel and $64.58 per barrel respectively.
Globally, the EIA predicts that oil demand is expected to rise by 1.5 million barrels per day in 2007, an increase of 0.7 million barrels per day above the 2006 growth. While China accounts for about one-third of world oil demand growth, most of the increase is due to reinvigorated demand in the United States. While it appears the market will be stable in the near future, the EIA cautions about short-term volatility:
“Prices could increase if weather or security-related disruptions continue to threaten production in OPEC and the rest of the world, or if delays in non-OPEC supply growth continue. Prices could decrease if oil demand growth slows or if Saudi Arabia decides to abandon production cuts in order to gain greater cooperation from other OPEC members. The effect of these cuts on oil prices could boost world oil demand growth in the short term.” In all, it seems as though the supply glut is finally working its way through the market. When inventories finally settle into a normal pattern, expect to see prices rebound.
Disclosure: Author has no position in the above-mentioned stocks.
No comments:
Post a Comment